
About This Report
The 9th edition of the VC Platform Compensation Report aims to bring transparency to one of the most idiosyncratic corners of venture capital—where fund structures, role definitions, and compensation philosophies vary dramatically across firms, geographies, functions, and seniority levels.
By benchmarking how platform professionals are compensated and valued, this survey enables individuals to negotiate more confidently, advocate for the impact of their roles, and chart a clearer career growth path. For employers, it provides the data needed to design competitive, equitable compensation frameworks that attract and retain top talent.
Platform compensation is uniquely variable due to a mix of factors, including fund size and AUM, ownership structure, geographic cost of living, level of partner engagement, and the expanding scope of the platform role (spanning talent, GTM, community, data, brand, operations, and more).
Since its launch, the accompanying Compensation Calculator has become one of VC Platform’s most-used resources, serving thousands of members annually to benchmark roles and inform performance reviews, hiring decisions, and career transitions. Members frequently cite it as a “reality check” and a “confidence booster” in critical compensation conversations.
In 2025, the survey expands to explore how compensation evolves with seniority, firm maturity, and new areas of value creation—including AI, data strategy, and platform leadership roles—alongside sentiment measures of career satisfaction and firm support.
Executive Summary
Survey History (2017-2025)
Since its inception in 2017, the VC Platform Compensation Survey has evolved in parallel with the growth and professionalization of the platform function itself. What began as a small peer benchmarking effort among early platform leaders has evolved into the industry’s most comprehensive dataset on how platform roles are defined, valued, and rewarded.
Over eight years, respondent participation has increased more than fourfold, reflecting both the expansion of VC Platform’s global membership and the function’s broader adoption across firm sizes and geographies. Once predominantly a U.S.-based community focused on mid-stage funds, the respondent base now includes global representation across 40+ countries, with a balance spanning new and emerging subfunctions under the platform umbrella.
During the same period, VC Platform’s community has grown from fewer than 200 professionals to thousands of members collectively managing trillions in AUM globally. This growth has fueled richer data inputs and more granular benchmarking across firm stages, AUM tiers, and functional subdomains.
Each year, new data fields have been introduced to capture the evolving dimensions of platform work—from equity participation (added in 2019) and team size (2020) to fund AUM segmentation (2021), carry participation (2022), and now career satisfaction, role scope, and perceived firm support (2025). These additions have allowed the survey to move beyond static pay benchmarks toward a multidimensional view of career structure and sentiment.
Because of this continuity, longitudinal trends have emerged that could only be revealed through sustained participation:
- Rising seniority and compensation growth as the function matures
- Increased alignment between role scope and title
- Expanded carry eligibility at larger funds
- Broader functional diversification beyond traditional talent and community tracks
- Globalization of platform as firms build local and distributed teams
Together, these trends underscore not only the evolution of compensation, but the evolution of platform itself as a leadership discipline within venture.

Methodology
All responses were normalized across geography, tenure, fund size, fund type, and functional role, and cleaned through a multi-stage process that included:
- Identifying and removing duplicate or incomplete entries
- Excluding investment-focused roles not primarily operating within platform functions
- Converting all compensation data to USD using contemporaneous exchange rates
- Standardizing geographic regions and fund-size bands
- Removing significant statistical outliers within each segment
- Harmonizing unique or free-text titles and functions to consistent categories
Additionally, quality and integrity measures included:
- Anonymization and aggregation of all data to protect respondent privacy
- Enforcing minimum cell-size thresholds (n ≥ 10) for any publicly reported segmentation
- Suppressing or merging data slices where confidentiality could be at risk
Together, these safeguards and processes ensure that every data point published reflects a statistically sound, ethically handled, and contextually normalized view of how platform professionals are compensated across the global venture ecosystem. While self-reported datasets inherently contain some variance, this methodology minimizes noise and maximizes comparability.

Base and Bonus Trends
Global platform compensation spans a wide range, reflecting the diversity of seniority, fund size, functional scope, and geographic cost of living across respondents. All data is presented in USD.
Base Salary:
The global base salary distribution shows meaningful dispersion.
- 10th percentile: $75,945
- Median [50th percentile]: $165,000
- 90th percentile: $350,000
Bonus Eligibility & Value:
Bonus participation remains uneven—only approximately 60% of respondents report receiving a bonus. Where bonuses exist, values vary widely by fund size and firm maturity.
- 10th percentile: $6,936
- Median: $26,993
- 90th percentile: $103,250
Total Cash Compensation (Base + Actual Bonus):
Total cash compensation shows a significant spread across the dataset.
- 10th percentile: $98,569
- Median: $207,500
- 90th percentile: $441,581
Contextual Macro Factors:
Several macro dynamics shape these numbers and the year-over-year movement within the dataset:
- A tighter fundraising environment, especially for emerging managers and smaller funds.
- Cooling but still elevated inflation, moderating from 2022 highs.
- Foreign exchange (FX) fluctuations are particularly impactful because all compensation is normalized to USD.

Linking Compensation to VC Market Sentiment
Compensation satisfaction closely tracks personal optimism and perceived career momentum. Respondents who received meaningful raises (10%+) or who fall into the top salary quartile report the highest satisfaction scores (3.7–4.1). By contrast, those without raises or in lower-salary bands report substantially lower satisfaction (3.0–3.3). Pessimism is concentrated among professionals who saw no increase in compensation or who sit in the lowest-paying segments.
While global medians appear stable year over year, this masks underlying volatility. Salaries in venture tend to be “sticky,” but the distribution of raises, bonuses, and carry changes tells the real story. In response to slower fundraising cycles and muted exits, many firms held base salaries flat, selectively reduced bonus pools, and exercised greater discretion in merit increases—mirroring the broader deceleration across the VC market.
Importantly, higher compensation correlates with higher satisfaction, but the data indicate it is not the strongest predictor. The clearest driver of compensation satisfaction is progression, not absolute pay. Respondents who received 10%+ raises reported nearly one full point higher satisfaction than peers with no raise—an effect size materially larger than differences across salary quartiles.
Seniority exhibits the same pattern. Directors, VPs, and senior platform executives report consistently higher satisfaction even after controlling for pay, suggesting that recognition, authority, and forward career motion matter more than static compensation alone.
Overall, satisfaction within platform roles is driven less by “how much I earn” and more by “how clearly my firm demonstrates that it values, invests in, and advances me.”

Cash Compensation Deep Dive
Across flagship platform roles, compensation clusters around skill scarcity, strategic impact, and bonus leverage.
Talent & Recruiting
These roles sit at the top of the platform pay pyramid, reflecting their direct impact on portfolio quality and firm performance. Talent is also one of the most bonus-leveraged platform functions.
- Base: ~$240,000
- Bonus: ~$55,000
- Total Cash: ~$300,000
Product, Data & AI
Compensation is similarly strong, driven by specialized expertise and increasingly critical data/AI mandates.
- Base: ~$225,000
- Bonus: ~$45,000
- Total Cash: ~$275,000
Community & Portfolio Support
This group represents the largest functional cohort and sits at the “center of gravity” for platform compensation.
- Base: ~$150,000
- Bonus: ~$20,000
- Total Cash: ~$190,000
Marketing, Brand & Events
Slightly lower base salaries but similar bonus patterns compared to community roles.
- Base: ~$135,000
- Bonus: ~$20,000
- Total Cash: ~$165,000
Global Compensation Patterns by Region
Total cash compensation varies significantly across geographies, reflecting both cost-of-living and firm-mix differences.
- North America: ~$240,000
- APAC: ~$200,000
- MENA: ~$145,000
- Europe: ~$130,000
- Latin & South America: ~$95,000
Latin & South America show the highest reliance on variable pay, while Europe and MENA remain more base-heavy. North America establishes the global compensation spine, anchored by larger AUM funds and more bonus-levered structures.
Compensation by AUM Band
AUM remains one of the strongest predictors of cash compensation. Mega-funds pay the most and rely more heavily on bonuses.
Median Total Cash by AUM:
- $2.5B+ AUM: ~$265,000
- $1.0–2.49B: ~$250,000
- $500–999M: ~$180,000
- $250–499M: ~$195,000
- $100–249M: ~$155,000
- < $100M: ~$130,000
Talent at mega-funds earns $100,000+ more in total cash than peers at sub-$250M funds. Bonus reliance is also highest at large, multi-fund platforms (~18–21% of total compensation).
Compensation by Firm Type / Asset Class
Growth and private equity, as well as corporate venture, consistently sit at the top of the cash compensation ladder.
- Growth / Private Equity: ~$240,000 total (base ~$210,000, bonus ~$50,000)
- Corporate VC: ~$225,000 total (base ~$175,000, bonus ~$30,000)
- Traditional Venture Capital: ~$200,000 total (base ~$150,000, bonus ~$25,000)
- Other: ~$185,000 totalGrowth and PE roles are the most bonus-leveraged, while traditional VC roles retain a higher share of guaranteed pay.
Where Base vs. Bonus Diverge Most
The widest gaps between base and bonus occur in:
- Growth/PE platform roles
- Mega-funds and upper-mid-size AUM funds
- North America and Latin & South America (higher variable reliance)
- Talent and Product/Data roles, which have the most incentive-driven structures
In contrast, marketing, community, and operations-heavy roles skew more heavily toward base salary with modest variable components.

Carry Insights
Carry Is Common – But Depth Is Uneven
Nearly half of respondents (~46%) received carry in one fund when they joined, while only ~12% received carry across all active funds. A meaningful ~19% received no carry at all, highlighting that access is widespread but not uniformly meaningful.
Seniority Is the Strongest Predictor of Eligibility
Carry participation rises sharply at the Director and VP levels and peaks at Partner/CXO roles. Analysts and Associates remain largely excluded, reinforcing that carry is still treated as a leadership incentive in most firms.
Capital Contributions for Carry Are Still the Exception, Not the Rule
The vast majority of platform professionals (77%) do not contribute capital toward their carry allocation. Only 23% finance their commitment – most commonly using after-tax income (14%), followed by smaller groups using pre-tax income (5%) or fund-provided loans (5%).
Vesting Is Mostly Linear – With a Clear Cliff Norm
The dominant vesting structure is straight-line with a cliff, with a 12-month cliff being by far the most common. Non-linear vesting remains rare, and a meaningful subset of respondents are unsure of their own vesting structure – signaling room for improved communication.
Satisfaction & Sentiment
Across all respondents, compensation satisfaction averages ~3.4 out of 5—squarely between Neutral (3) and Somewhat Satisfied (4). This score reflects a generally steady but cautious sentiment in the current VC environment. Patterns in year-over-year movement also suggest pressure on perceived value:
- 26% of respondents received no increase this year
- 22% received a 5% or smaller increase
These two buckets alone account for nearly half of all respondents, likely contributing to more moderate satisfaction levels.
What Predicts Satisfaction?
1.) Pay Level Matters—But Not as Much as Progression
When segmented by pay quartile, higher-compensated employees consistently report higher satisfaction. The linear relationship—with high n-counts across quartiles—suggests platform professionals have a strong internal reference point for what is “fair” compensation for their role, fund size, and seniority. Firms should treat that signal seriously.But the most powerful predictor is change, not level:
- Respondents with 10%+ raises show nearly a full point higher satisfaction than those with no raise.
- Those receiving ≤5% increases report satisfaction levels nearly identical to those with no increase.
- This dynamic holds regardless of seniority, indicating that even well-paid senior employees value progress more than static compensation.
In short: Movement = satisfaction; stagnation = dissatisfaction.
2.) Seniority Strongly Correlates with Satisfaction
VPs, Directors, and Partner-level platform leaders report higher compensation satisfaction than analysts and associates—even after controlling for pay. This may signal:
- Greater recognition and influence at senior levels,
- Better alignment between role scope and compensation, and/or
- Generational differences in expectations around advancement and reward.
Regardless of the cause, title progression and perceived influence matter as much as pay itself.
3.) Pay Increases are a More Accurate Predictor Than Pay Levels
When comparing satisfaction with pay increases across levels, satisfaction scores remain remarkably consistent. Whether someone is an Associate or a VP, a 10% raise produces the same uplift in sentiment, suggesting that the psychological effect of recognition is universal across seniority levels.
4.) Promotion Processes are a Critical Hidden Driver
One of the clearest predictors of low satisfaction has nothing to do with pay at all: lack of a formal promotion process .
Employees who report that their firm lacks a clear framework for evaluating or advancing talent show significantly lower satisfaction, even when their compensation is competitive for their role and level.
This finding reinforces a broader theme across the survey: Platform professionals value clarity, progress, and fairness as much as—if not more than—absolute dollars.
Career Intentions & Satisfaction
Nearly half of respondents (47%) view platform as their long-term career path, while smaller groups see it as a stepping stone to operating roles (13%), founding their own company (6%), or investing (4%). A notable 22% remain unsure about where the role leads.
These intentions map to satisfaction levels. Those who see platform as a long-term destination generally report higher compensation satisfaction, mirroring themes around clarity, progression, and firm investment. By contrast, respondents who are uncertain about their future or view platform as a transitional role tend to show lower satisfaction, even when their pay is competitive.
In short, career clarity and a clear future in platform are strong predictors of overall sentiment, while uncertainty aligns with weaker satisfaction.

Strategic Takeaways & Recommendations
The 2025 VC Platform Compensation Survey is more than a benchmarking tool—it’s a strategic instrument for shaping careers, firm design, and the future of the platform function.
For Platform Professionals
Use the data to inform your own career and compensation trajectory:
- Benchmark your total compensation against peers by fund size, geography, and seniority.
- Identify pathways to advancement by comparing role scope, team structure, and pay progression.
- Leverage insights in negotiation and reviews—anchoring conversations in industry norms while articulating the unique value your role creates.
- Track non-monetary indicators (title alignment, firm support, growth sentiment) to evaluate long-term career sustainability, not just pay.
For Firms
The data reveals both competitive pressure and opportunity. Leading firms are:
- Reevaluating pay architecture to align compensation with firm size, strategic impact, and evolving role scope.
- Expanding carry participation to include key platform leaders—recognizing their direct influence on fund performance and founder outcomes.
- Clarifying role levels and expectations to reduce ambiguity across titles and compensation bands.
- Integrating structured feedback and growth pathways to retain top performers in an increasingly competitive market for platform talent.
Together, these insights equip individuals, firms, and the broader community to build more transparent, equitable, and high-performing venture organizations—where platform talent is recognized as central to value creation.

Thank you to our Partner
We are delighted to work with our community sponsor Sequoia to bring this project to life. Sequoia is a pioneer in total people investment. They help companies master the practice of driving outcomes that matter through their people-focused work on compensation, benefits, wellbeing, HR and payroll, and business protection.
Learn More About Sequoia
“Thoughtful, data-driven, and actionable—VC Platform’s Compensation Survey sets a new standard for our industry. Partnering with VC Platform allows Sequoia to support leaders in shaping the future with clarity and conviction.”
Kyle HolmVP, Compensation Advisory

 Kyle HolmVP, Compensation Advisory
 Rebekah WillettsSenior Business Consultant
 Sam SpiegelmanClient Consultant, Compensation Advisory
 Sonya ChangCompensation Analyst
We’d Like to Recognize the Following:


Survey 2025
Individuals From 1,000+ Firms Were Invited to Participate
Representation from world-class firms, including:


Who Took the Survey?
Gender Identity
Gender identity breakdown of who responded
Titles
What title best matches your own?
- 10%Analyst/Associate (64)
3-6 Years of Experience - 21%Manager/Sr. Associate (130)
6-10 Years of Experience - 30%Director (190)
10-14 Years of Experience - 20%Vice President/Sr. Vice President (127)
12-18 Years of Experience - 19%Partner/CxO (117)
15-24 Years of Experience
Primary Role
Count of what is the primary focus of your role
- 25%Community & Portfolio Support (158)
- 16%Talent & Recruiting (102)
- 23%Marketing, Content , & Events (143)
- 10%Business Development & Partnership (61)
- 14%Internal Operations (86)
- 5%Investor Relations / Fundraising (34)
- 3%Investment Sourcing/Diligence (16)
- 3%Product, Data, & AI (23)
- 1%ESG (5)
Respondents Firm Information
Firm Assets Under Management
- 13%Less Than $100M USD (79)
- 17%$100M - $249M USD (109)
- 14%$250M- $499M USD (90)
- 14%$500M - $999M USD (91)
- 18%$1.0Bn - $2.49Bn USD (112)
- 23%More than $2.5Bn USD (142)
- 1%We don't manage any capital
(5)
Fund Type
- 75%Venture Capital Firm (473)
- 10%Corporate Venture Capital Firm (57)
- 12%Growth/Private Equity (77)
- 3%Other (21)
Investment Stage
- 5%Pre-Seed (30)
- 24%Early Stage: Seed → Series B (152)
- 5%Growth Stage: Series B → Series D (29)
- 0%Late Stage Growth: Series E+ (2)
- 65%Multi Stage (410)
- 1%Private Equity / Buy Out (5)
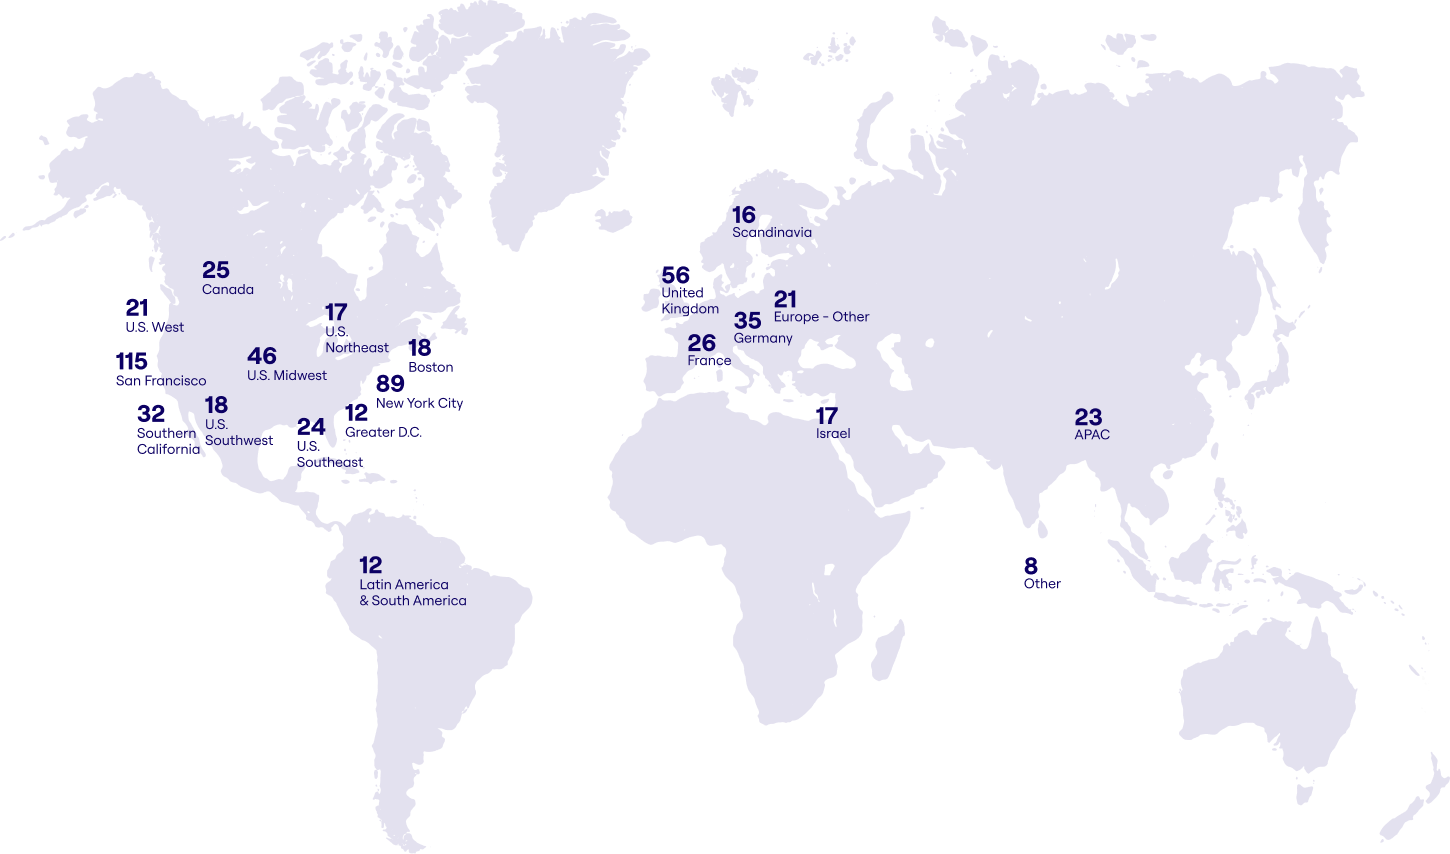
Respondents Geography
Compensation Calculator
A member-exclusive tool to empower you to explore personalized compensation insights based on your role, tenure, geography, and firm characteristics.
Base Compensation Trends & Analysis
Base Salary Compensation Trends by Firm AUM
Base Salary Compensation Trends by Firm Function
Base Salary Compensation Trends by Role Function
Bonus Compensation
Bonus as a Percentage of Base Salary
Of Respondents Receive a Bonus
Of Respondents Receive a Bonus
Of Respondents Receive a Bonus
Of Respondents Receive a Bonus
Of Respondents Receive a Bonus
Of Respondents Receive a Bonus
- 30%0-10% of base compensation (112)
- 30%10-20% of base compensation (112)
- 18%20-30% of base compensation (68)
- 14%30-40% of base compensation (46)
- 4%40-50% of base compensation (15)
- 4%50%+ of base compensation (15)
How is Your Bonus Payout Determined?
Un-Diluted: Eligible and Paid?
Diluted: Eligible and Paid?
- 50%0-10% of base compensation (15)
- 27%10-20% of base compensation (8)
- 13%20-30% of base compensation (4)
- 3%30-40% of base compensation (1)
- 3%40-50% of base compensation (1)
- 3%50%+ of base compensation (1)
How is Your Bonus Payout Determined?
- 30%0-10% of base compensation (18)
- 34%10-20% of base compensation (21)
- 25%20-30% of base compensation (15)
- 7%30-40% of base compensation (4)
- 2%40-50% of base compensation (1)
- 3%50%+ of base compensation (2)
How is Your Bonus Payout Determined?
- 40%0-10% of base compensation (49)
- 29.9%10-20% of base compensation (37)
- 19%20-30% of base compensation (23)
- 8%30-40% of base compensation (10)
- 2%40-50% of base compensation (2)
- 1.8%50%+ of base compensation (2)
How is Your Bonus Payout Determined?
- 17%0-10% of base compensation (14)
- 33%10-20% of base compensation (27)
- 16%20-30% of base compensation (13)
- 19%30-40% of base compensation (16)
- 10%40-50% of base compensation (8)
- 6%50%+ of base compensation (5)
How is Your Bonus Payout Determined?
- 23%0-10% of base compensation (16)
- 27%10-20% of base compensation (19)
- 19%20-30% of base compensation (13)
- 21%30-40% of base compensation (15)
- 4%40-50% of base compensation (3)
- 6%50%+ of base compensation (4)
How is Your Bonus Payout Determined?
Carry Trends
Carry Trends by Title
Carry Questions
When you INITIALLY joined your firm, what fund(s) were you awarded carry in?
- 46%Awarded carry in the ONE most recently raised active fund at my firm upon joining (177)
- 16%Awarded carry in the TWO most recently raised active funds at my firm upon joining (63)
- 12%Awarded carry in ALL active funds at my firm upon joining, including historic funds (44)
- 19%Awarded carry in any funds upon joining (72)
- 3%Firm had not raised any funds upon joining (11)
- 4%Other (15)
Do you contribute capital towards your portion of carried interest?
- 77%No (285)
- 14%Yes, using after-tax income (50)
- 5%Yes, but using a loan from my fund (18)
- 4%Yes, using pre-tax income (17)
Carry Vesting Practices
Vesting Method
- 43%Straight-line/linear vesting with a cliff (133)
- 27%Straight-line/linear vesting with no cliff (84)
- 13%Other (non-linear vesting)
(41) - 17%I’m not sure
(53)
Cliff Vesting Practices
- 5%N/A - No Cliff (10)
- 67%12 Months (119)
- 2%18 Months (3)
- 15%24 Months (26)
- 6%36 Months (11)
- 5%Other
(9)
Vesting Schedule
Vesting Method VS. Length
| Linear | Non-Linear | ||
|---|---|---|---|
| 1-3 Years | 93% (13) | 7% (1) | |
| 4-5 Years | 98% (82) | 2% (2) | |
| 6-7 Years | 92% (46) | 8% (4) | |
| 8-9 Years | 81% (29) | 19% (7) | |
| 10+ Years | 67% (46) | 33% (23) | |
Parental Leave
Does your firm have a parental leave policy?
How Long Does the Primary Caregiver Receive Full Salary?
- 4%1 Month
(11) - 8%2 Months
(22) - 30%3 Months
(80) - 27%4 Months
(73) - 13%5 Months
(35) - 18%6+ Months
(49)
How Long Does the Secondary Caregiver Receive Full Salary?
- 28%1 Month
(43) - 29%2 Months
(45) - 15%3 Months
(23) - 13%4 Months
(20) - 6%5 Months
(9) - 9%6+ Months
(14)
Does your firm have a parental leave policy?
How Long Does the Primary Caregiver Receive Full Salary?
- 4%1 Month
(8) - 10%2 Months
(19) - 37%3 Months
(68) - 29%4 Months
(52) - 10%5 Months
(19) - 9%6+ Months
(16)
How Long Does the Secondary Caregiver Receive Full Salary?
- 28%1 Month
(30) - 26%2 Months
(28) - 21%3 Months
(22) - 19%4 Months
(20) - 3%5 Months
(3) - 3%6+ Months
(3)
Does your firm have a parental leave policy?
How Long Does the Primary Caregiver Receive Full Salary?
- 6%1 Month
(3) - 4%2 Months
(2) - 10%3 Months
(5) - 19%4 Months
(9) - 8%5 Months
(4) - 52%6+ Months
(25)
How Long Does the Secondary Caregiver Receive Full Salary?
- 28%1 Month (7)
- 36%2 Months (9)
- 0%3 Months (0)
- 0%4 Months (0)
- 8%5 Months (2)
- 28%6+ Months (7)
Does your firm have a parental leave policy?
How Long Does the Primary Caregiver Receive Full Salary?
- 0%1 Month
(0) - 0%2 Months
(0) - 17%3 Months
(2) - 17%4 Months
(2) - 58%5 Months
(7) - 8%6+ Months
(1)
Does your firm have a parental leave policy?
How Long Does the Primary Caregiver Receive Full Salary?
- 4%1 Month
(1) - 8%2 Months
(2) - 8%3 Months
(2) - 12%4 Months
(3) - 12%5 Months
(3) - 58%6+ Months
(15)
How Long Does the Secondary Caregiver Receive Full Salary?
- 26%1 Month (5)
- 37%2 Months (7)
- 0%3 Months (0)
- 0%4 Months (0)
- 12%5 Months (3)
- 58%6+ Months (15)
Does your firm have a parental leave policy?
Does your firm have a parental leave policy?
Does your firm have a parental leave policy?
Does your firm have a parental leave policy?
Does your firm have a parental leave policy?
How Long Does the Primary Caregiver Receive Full Salary?
- 0%1 Month (0)
- 0%2 Months (0)
- 0%3 Months (0)
- 33%4 Months (5)
- 27%5 Months (4)
- 40%6+ Months (6)
Does your firm have a parental leave policy?
Does your firm have a parental leave policy?
How Long Does the Primary Caregiver Receive Full Salary?
- 11%1 Month
(1) - 22%2 Months
(2) - 44%3 Months
(4) - 11%4 Months
(1) - 0%5 Months
(0) - 11%6+ Months
(1)
Does your firm offer more than the mandatory parental leave?
Remote Work
How many days do you work in your office?
United States
- 25%I am fully remote
(96) - 6%1 - 2 days per MONTH in the office (22)
- 8%1 day per WEEK in the office
(33) - 36%2 - 3 days per WEEK in the office (141)
- 25%4 - 5 days per WEEK in the office (97)
Europe
- 6%I am fully remote
(10) - 7%1 - 2 days per MONTH in the office (11)
- 5%1 day per WEEK in the office
(7) - 38%2 - 3 days per WEEK in the office (58)
- 44%4 - 5 days per WEEK in the office (68)
Sentiment
Satisfaction
- 5%Very Pessimistic (32)
- 20%Somewhat Pessimistic (126)
- 19%Neutral (117)
- 38%Somewhat Optimistic (239)
- 18%Very Optimistic (14)
Salary Changes in the Most Recent 12-Months
- 22%Increased by <5% (136)
- 17%Increased by 5-10% (107)
- 9%Increased by 11-15% (56)
- 6%Increased by 16-20% (39)
- 8%Increased by >20% (48)
- 25%No increase (161)
- 13%Not applicable (81)
Primary Drivers for Promotions
- 20%Firm fund cycles (123)
- 66%Personal performance (418)
- 7%Predetermined time based bands (42)
- 4%No formal process (23)
- 3%I don't know (22)
Optimism Around Firm's Future Performance
- 1%Very Pessimistic (4)
- 7%Somewhat Pessimistic (45)
- 15%Neutral (92)
- 47%Somewhat Optimistic (299)
- 30%Very Optimistic (188)
Firm’s Anticipated Headcount Growth in the Next 12-Months
- 26%Yes, on both the investment and platform teams (164)
- 21%Yes, only on the investment team (132)
- 4%Yes, only on the platform team (24)
- 0%Yes but not sure where (1)
- 31%No (195)
- 18%I'm not sure (112)
Outlook on Current Role in Anticipated Career Plans
- 47%Long term career destination (297)
- 4%Stepping stone to investment role at VC/PE firm (27)
- 13%Stepping stone to operating role at startup/corporate (81)
- 6%Stepping stone to founding own company (35)
- 8%Transitional role while exploring options (48)
- 22%Unsure (140)
Satisfaction with Total Compensation by Most Recent Raise
Chart is on a scale of 1 - 5, where: 🟥 1 = Very Dissatisfied 🟧 2 = Somewhat Dissatisfied 🟨 3 = Neutral 🟦 4 = Somewhat Satisfied 🟩 5 = Very Satisfied
Increased by <5%
Increased by 5-10%
Increased by 11-15%
Increased by 16-20%
Increased by >20%
No increase
Not applicable
All
Increased by <5%
Increased by 5-10%
Increased by 11-15%
Increased by 16-20%
Increased by >20%
No increase
Not applicable
All
Increased by <5%
Increased by 5-10%
Increased by 11-15%
Increased by 16-20%
Increased by >20%
No increase
Not applicable
All
Increased by <5%
Increased by 5-10%
Increased by 11-15%
Increased by 16-20%
Increased by >20%
No increase
Not applicable
All
Increased by <5%
Increased by 5-10%
Increased by 11-15%
Increased by 16-20%
Increased by >20%
No increase
Not applicable
All
Increased by <5%
Increased by 5-10%
Increased by 11-15%
Increased by 16-20%
Increased by >20%
No increase
Not applicable
All
Increased by <5%
Increased by 5-10%
Increased by 11-15%
Increased by 16-20%
Increased by >20%
No increase
Not applicable
All
Increased by <5%
Increased by 5-10%
Increased by 11-15%
Increased by 16-20%
Increased by >20%
No increase
Not applicable
All
Increased by <5%
Increased by 5-10%
Increased by 11-15%
Increased by >20%
No increase
Not applicable
All
Increased by <5%
Increased by 5-10%
Increased by 11-15%
Increased by 16-20%
Increased by >20%
No increase
Not applicable
All
Increased by <5%
Increased by 5-10%
Increased by 16-20%
Increased by >20%
No increase
Not applicable
All
Increased by <5%
Increased by 11-15%
Increased by 16-20%
Increased by >20%
No increase
Not applicable
All
Satisfaction with Total Compensation by Quartile
Chart is on a scale of 1 - 5, where: 🟥 1 = Very Dissatisfied 🟧 2 = Somewhat Dissatisfied 🟨 3 = Neutral 🟦 4 = Somewhat Satisfied 🟩 5 = Very Satisfied